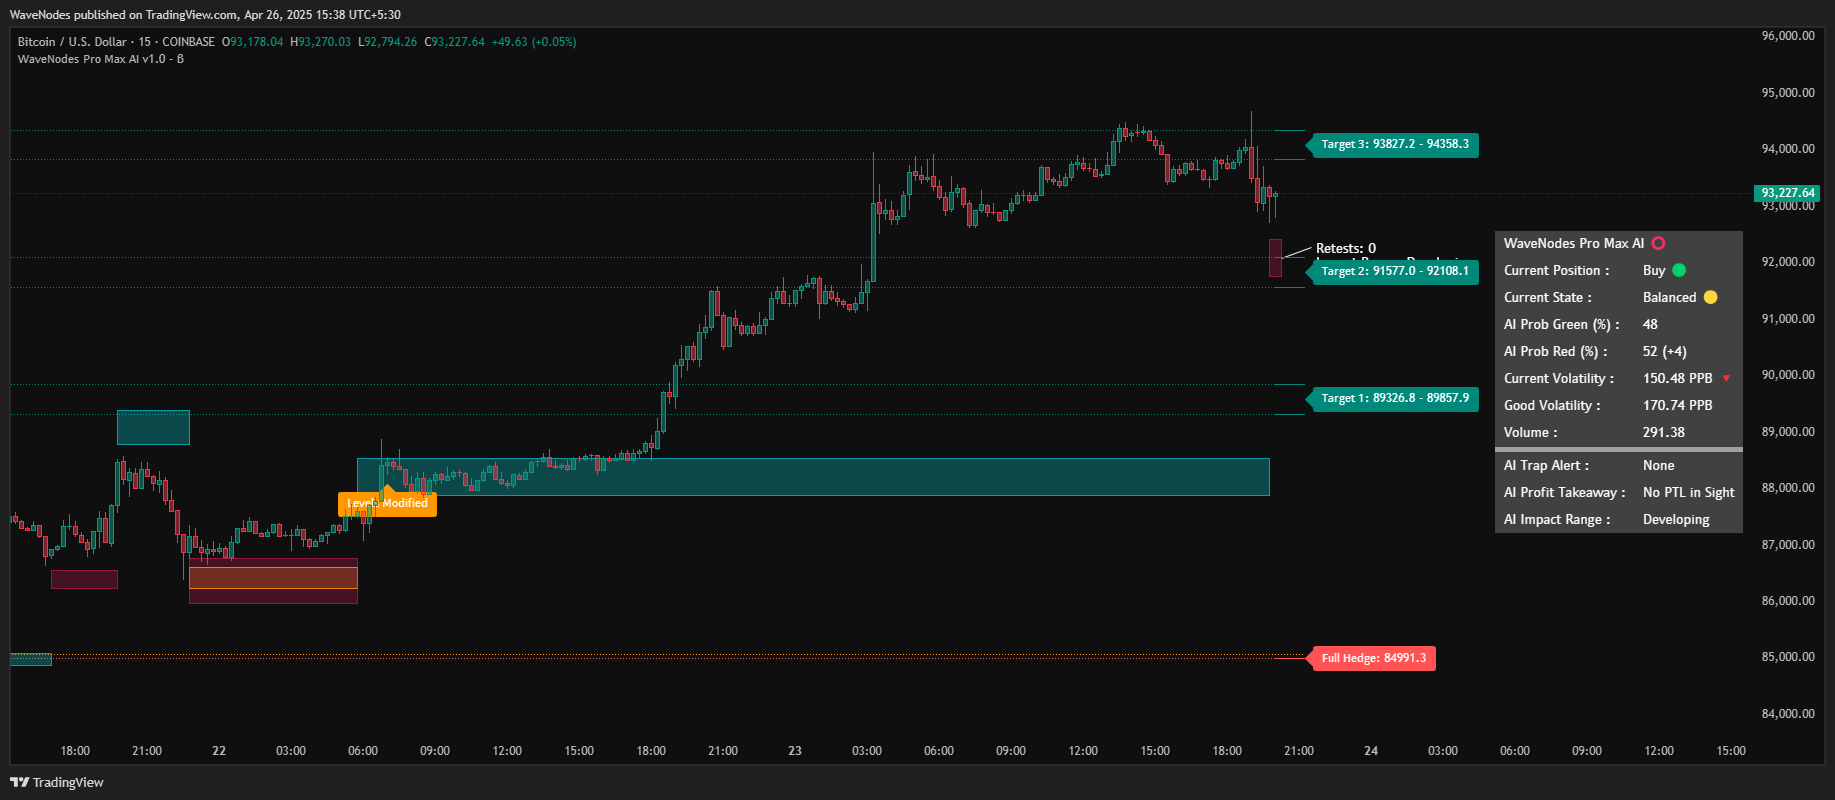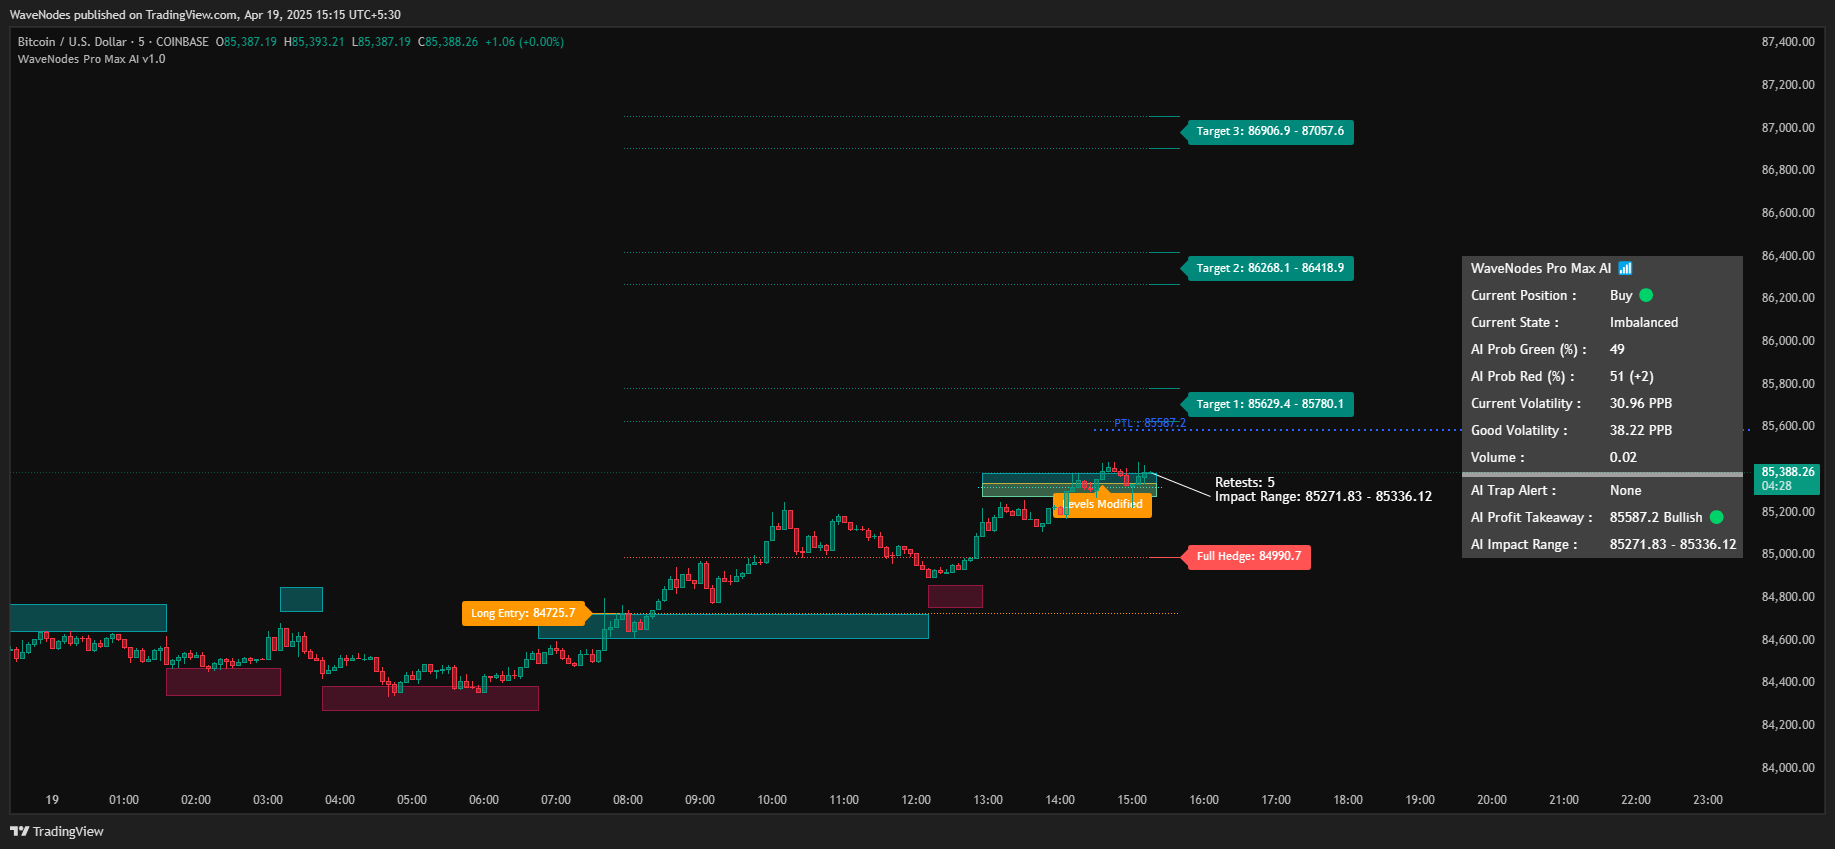

Advanced Target Projection System
Markings showing how target system projects zones and levels on breakouts

Markings showing how target system projects zones and levels on breakouts

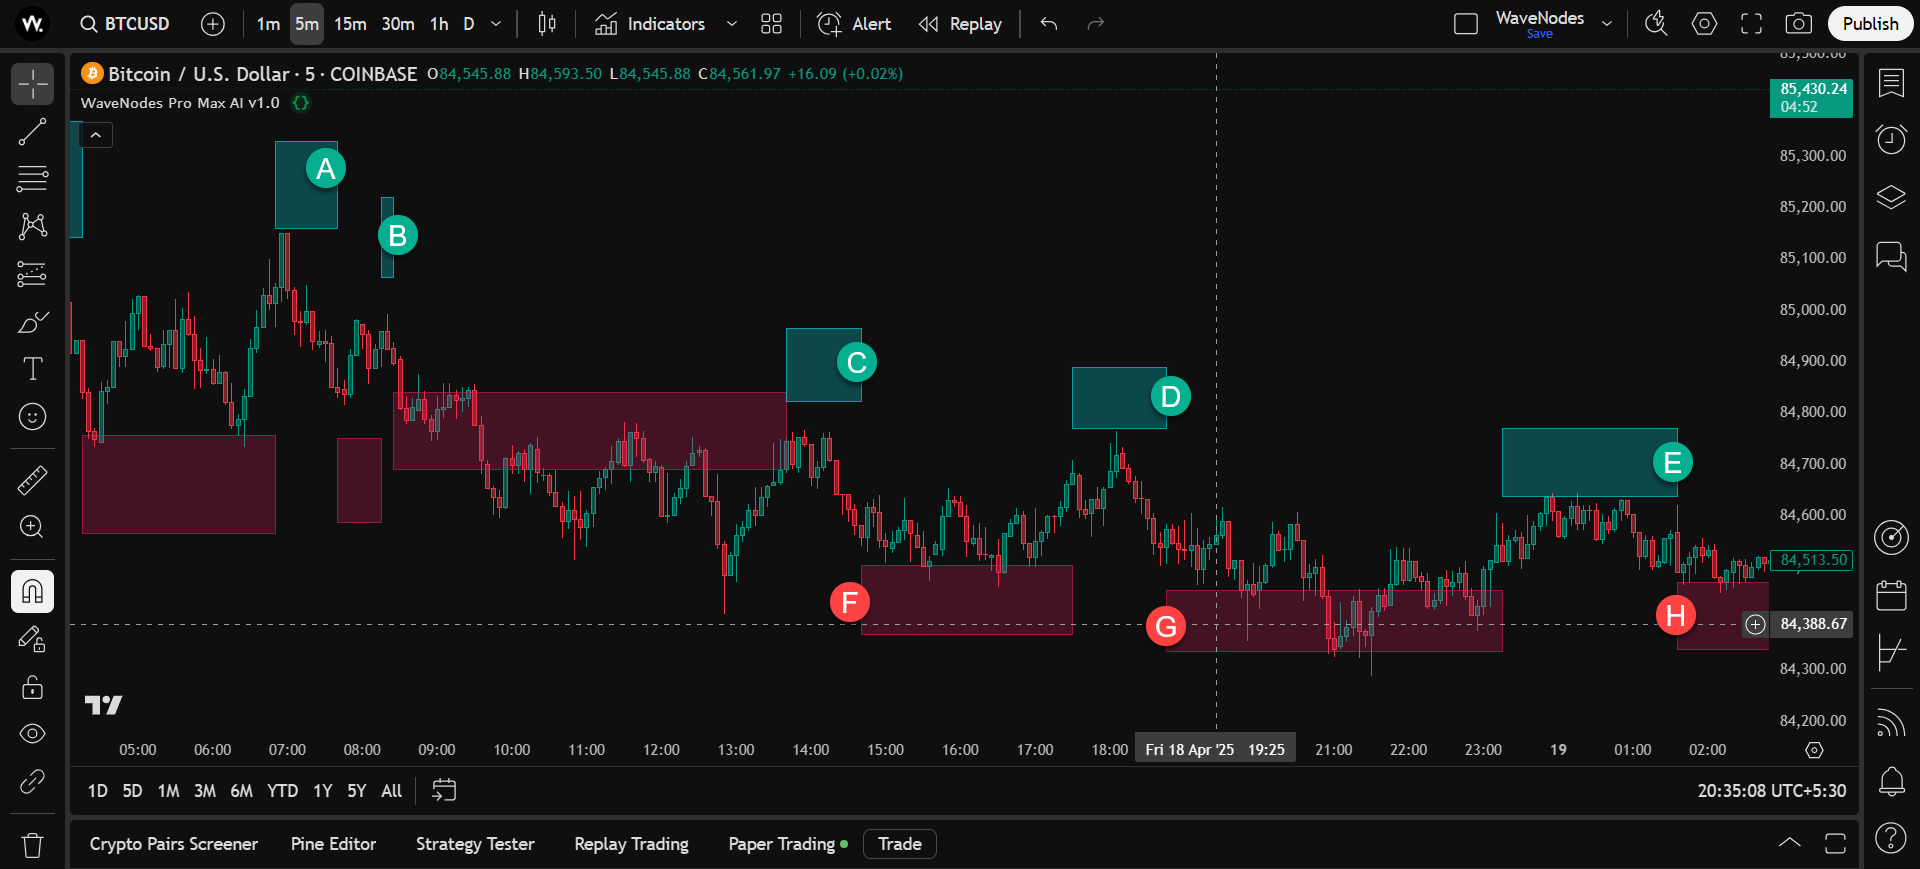
Bitcoin chart showing modified opportunity build up on long side on 5 min timeframe
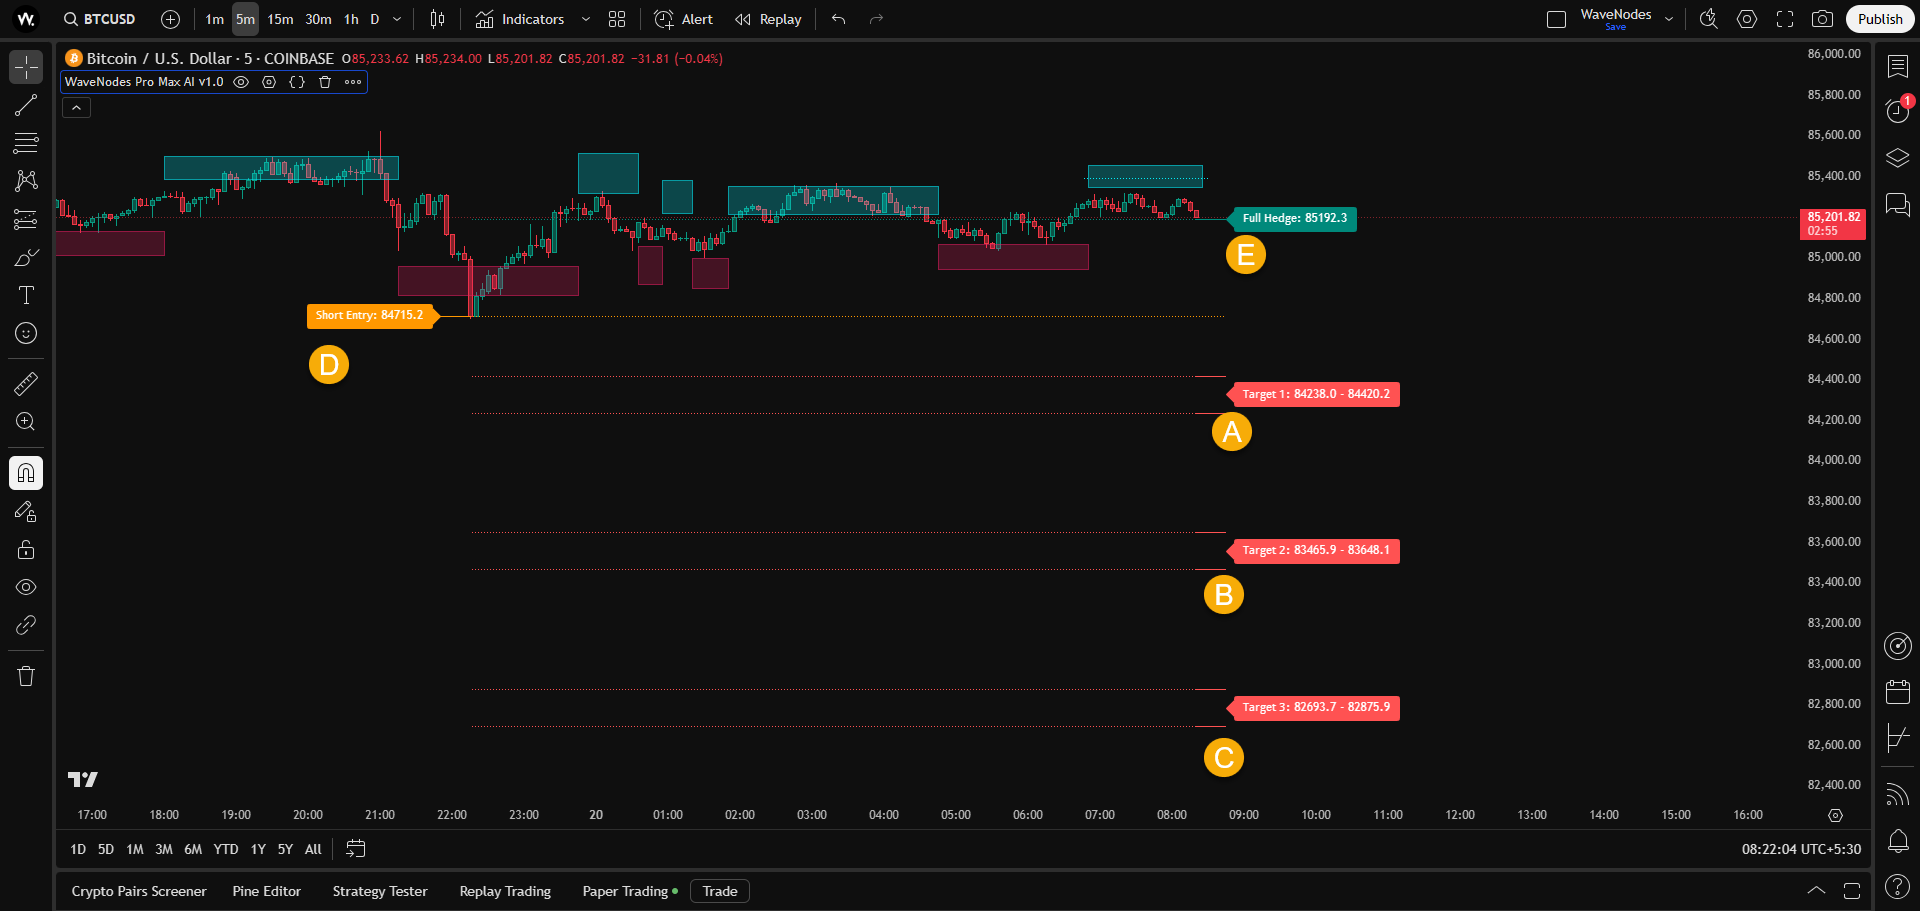
System calculating and projecting dynamic support and resistances as price action develops
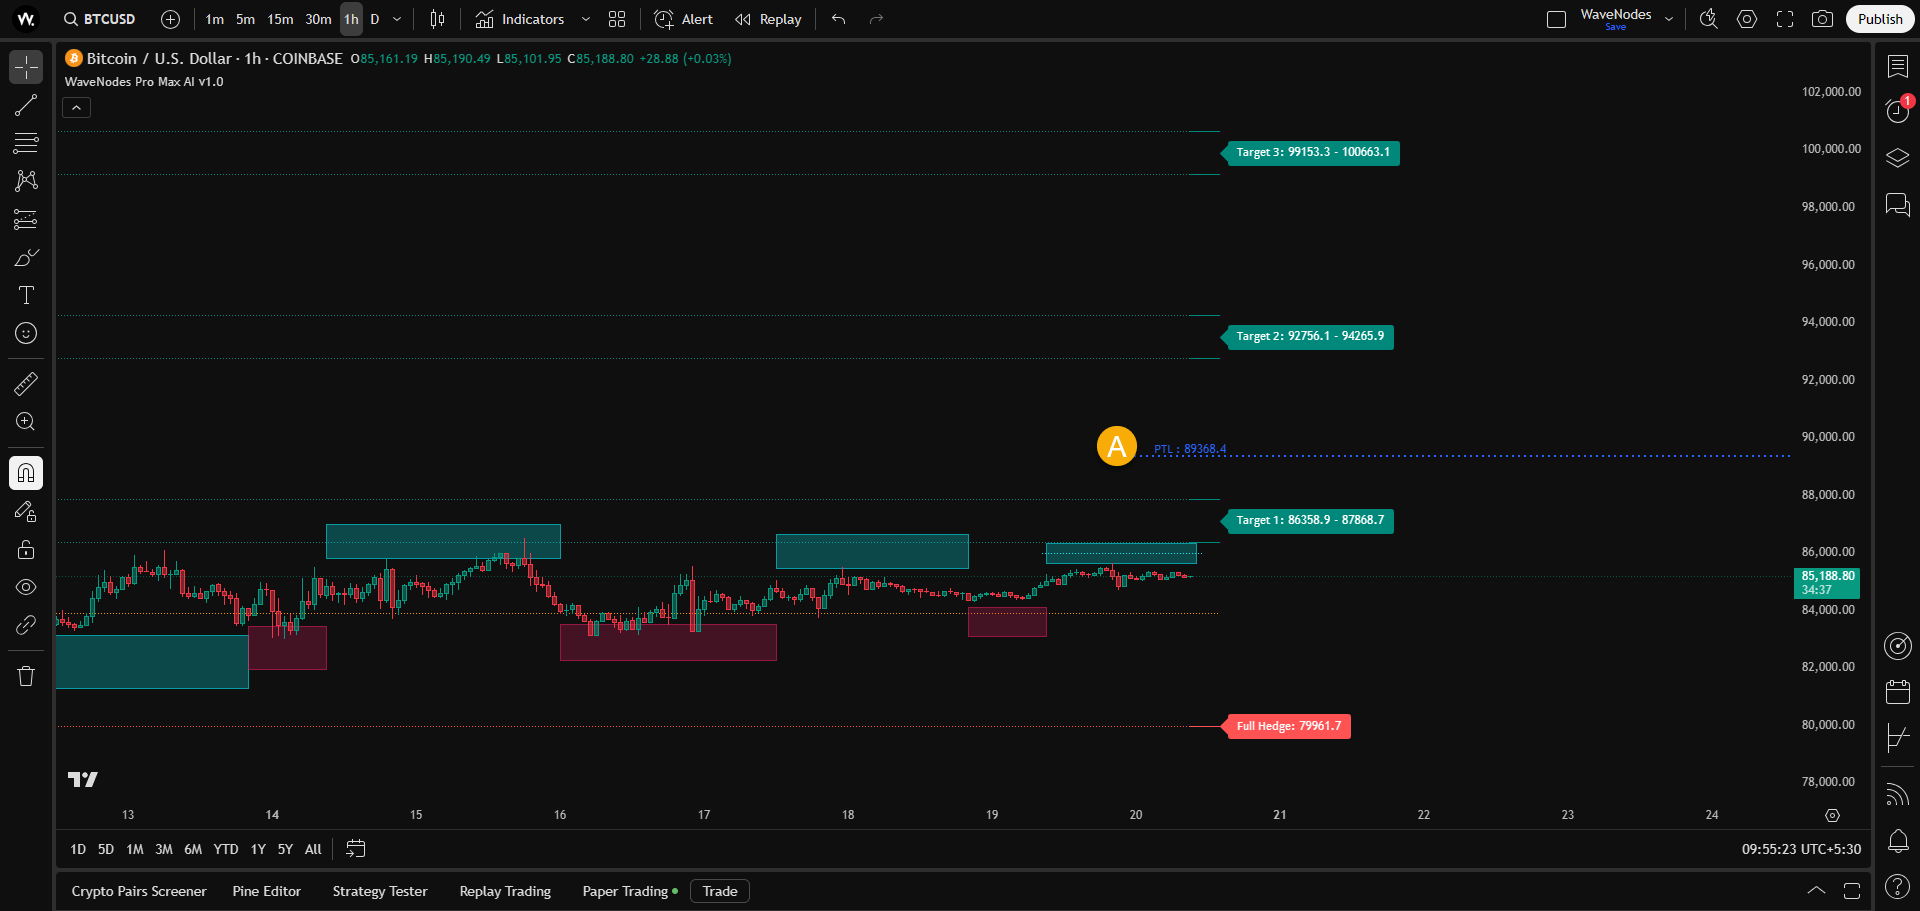

Chart marks trailing zone that acts as risk manager during bigger trends.

PTL module, a north star, showing key level for booking daily long term trades.
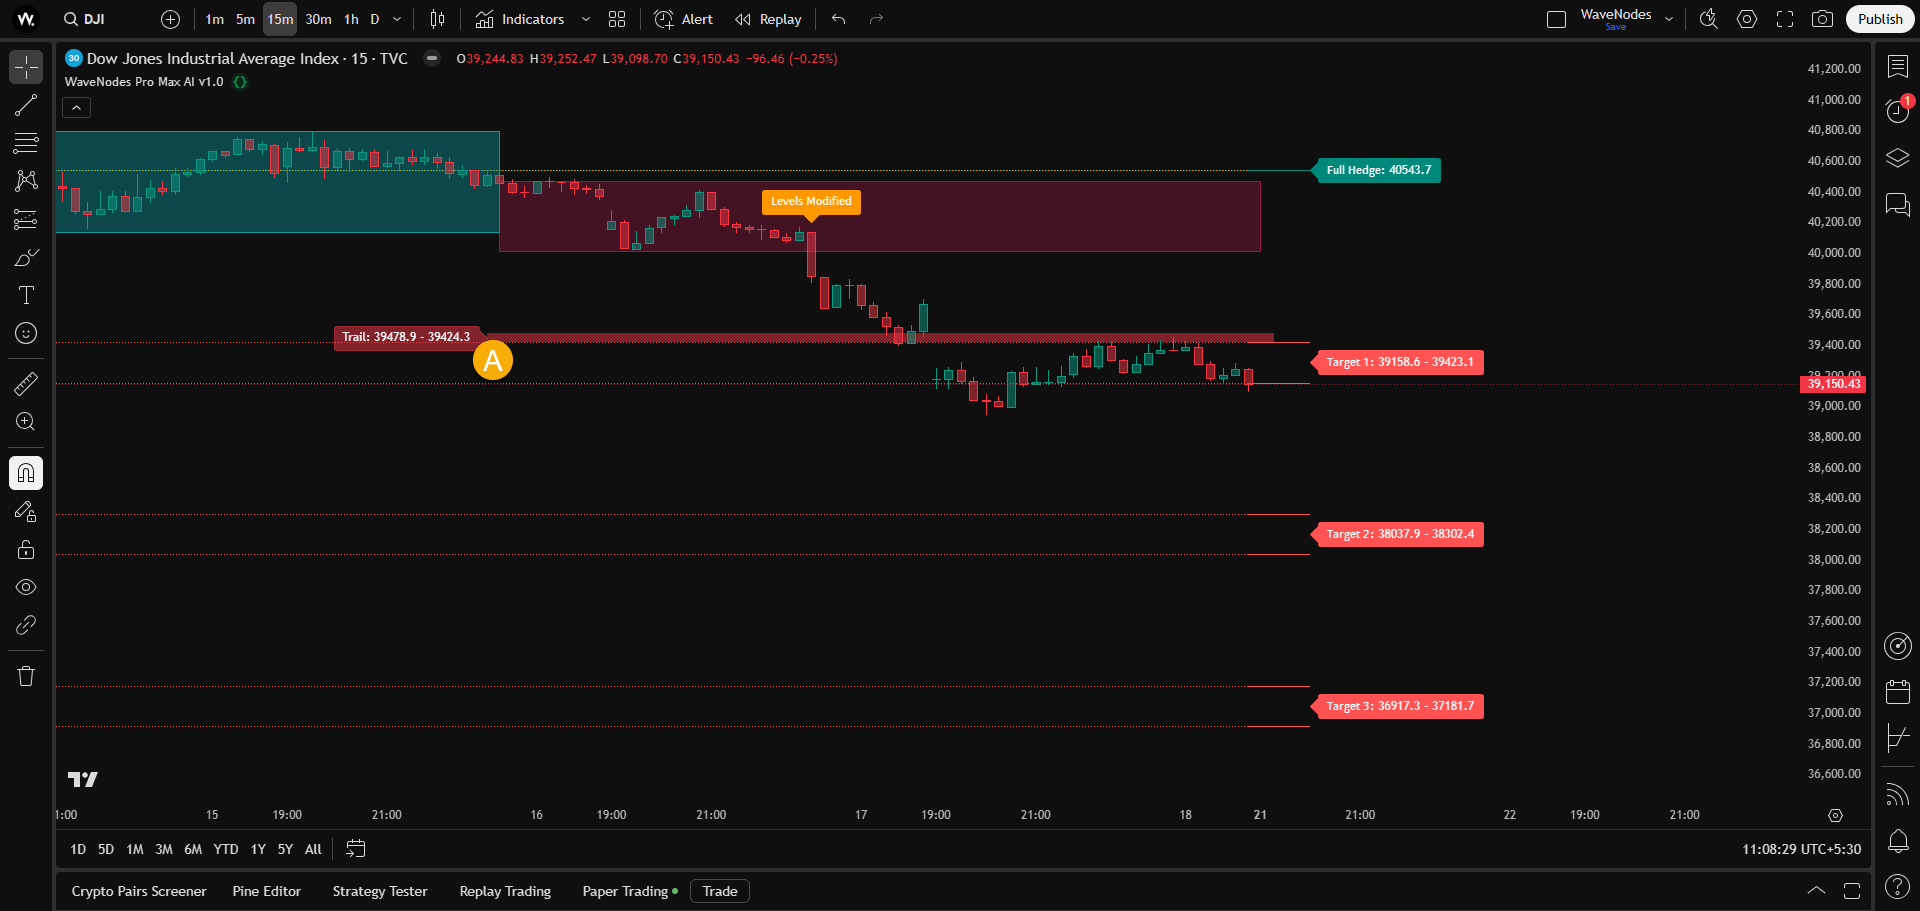
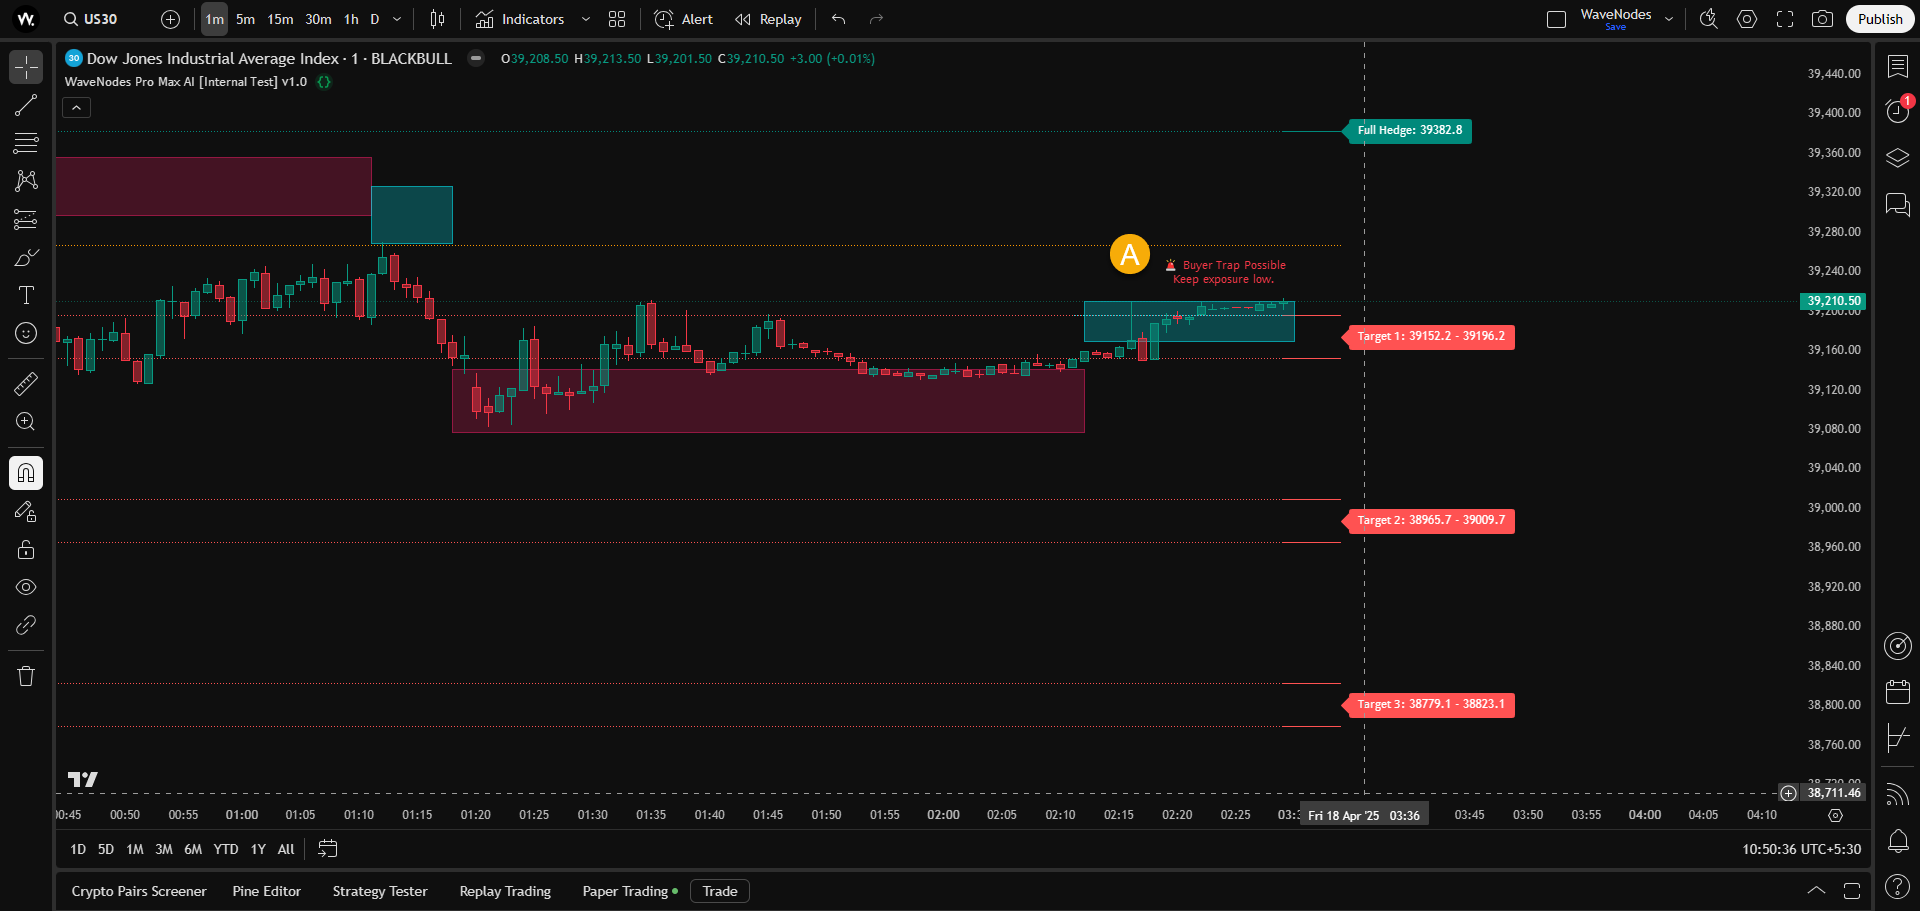
Chart showing how Buyer Trap Alert on chart helps save traders from getting trapped in fake moves.
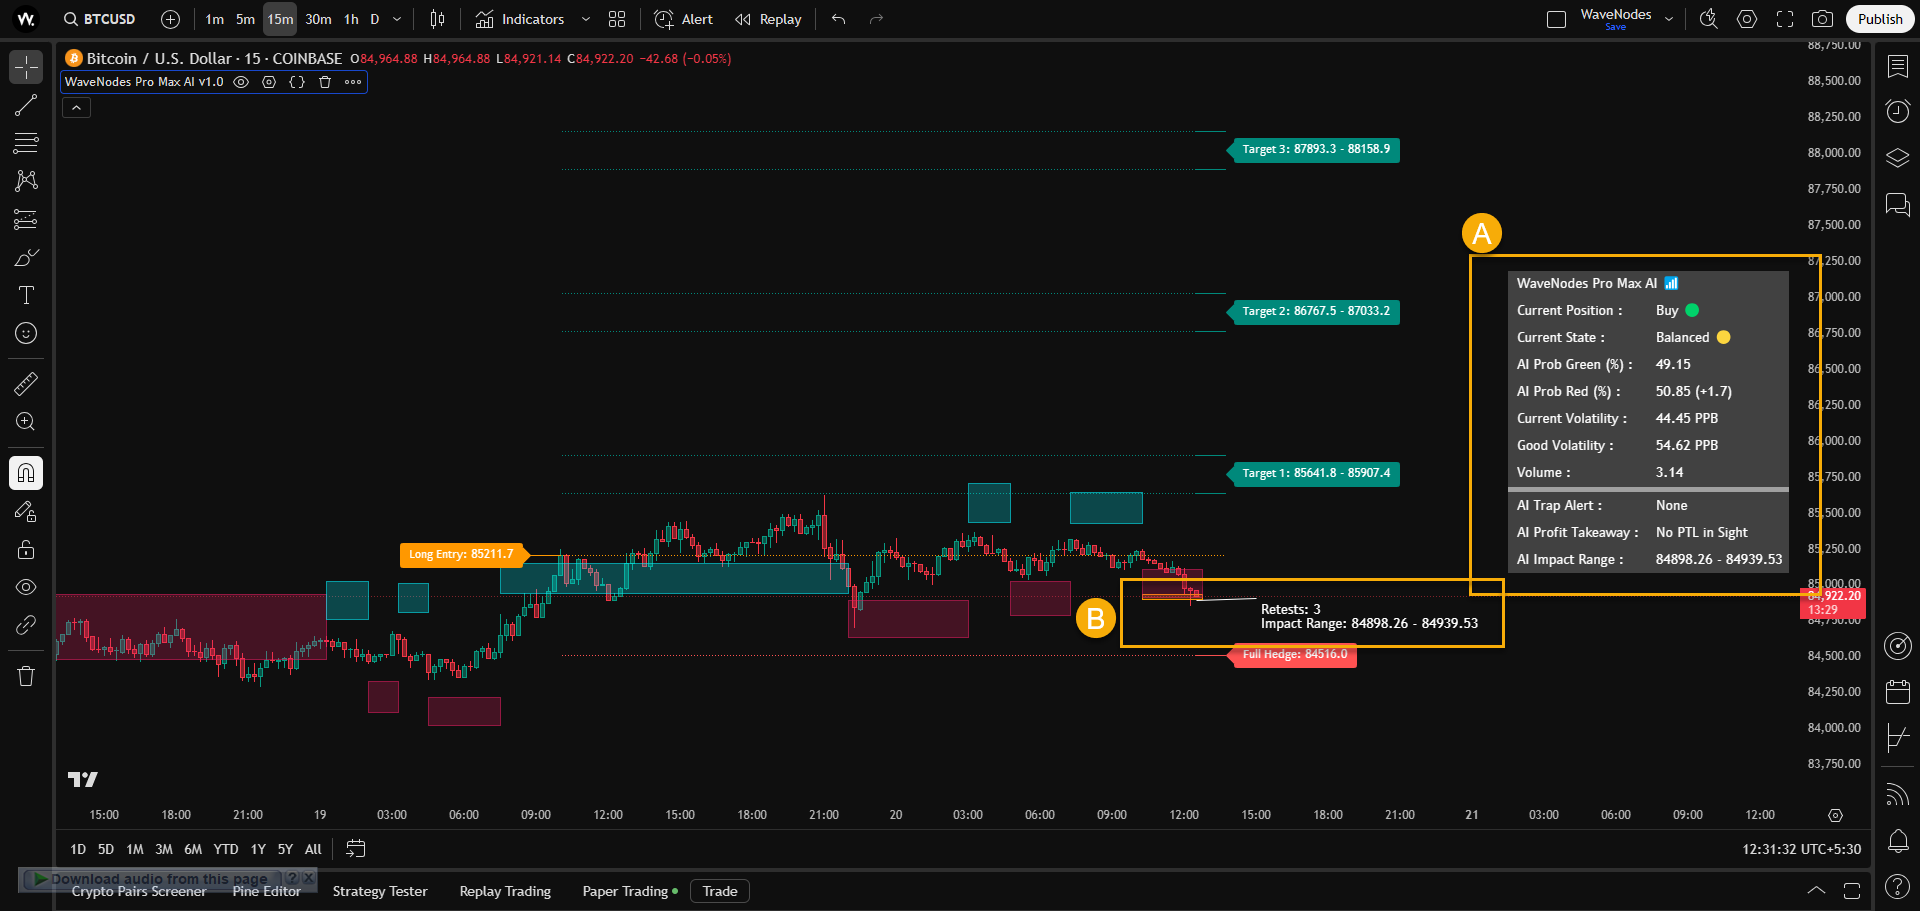
Real time analytics dashboard showing critical pieces of information during the trade.