Intellizones 2026 - Options Analysis Tool Interface
Professional Options Analysis Tool for TradingView. Make informed trading decisions with advanced accumulation and distribution tracking.
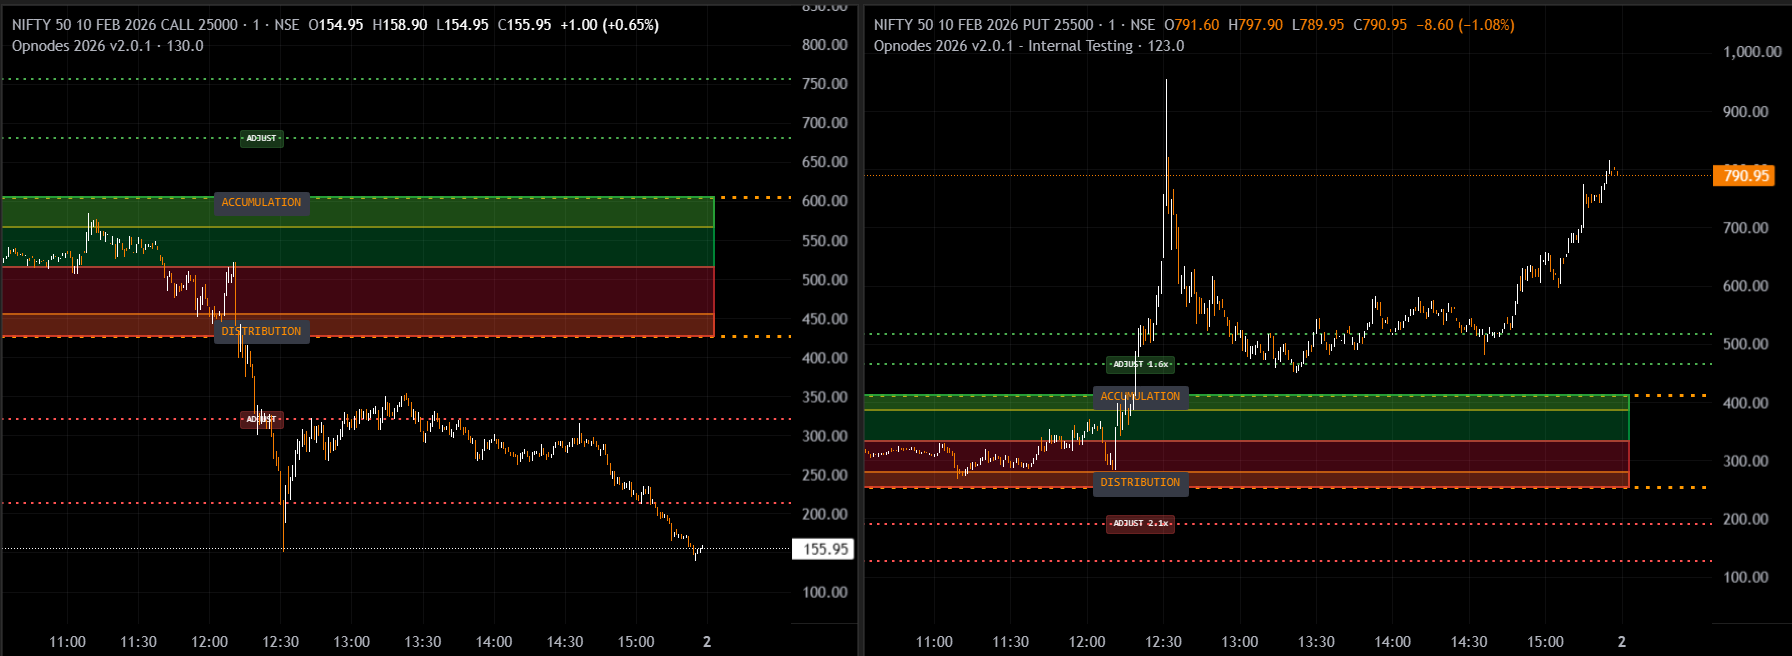
OpNodes 2026 is a sophisticated intraday analysis tool designed for options traders seeking to identify optimal entry and exit points through accumulation and distribution patterns.
Understanding these fundamental concepts will help you make the most of OpNodes 2026:
Discover the powerful capabilities that make OpNodes 2026 an essential tool for options traders.
All zones are automatically calculated and updated at market opening, saving you time and ensuring accuracy. No manual calculations required.
Red and green boxes clearly highlight decision zones for assessing developing market views using options data.
Supports option writers when India VIX is falling and assists buyers when India VIX is rising, adapting to market volatility.
Specifically designed for intraday analysis, providing real-time insights throughout the trading session.
Use Call and Put options together for comprehensive decision-making and better market assessment.
Dotted lines indicate zones where trade adjustments may be necessary, helping you manage positions effectively.
Follow these simple steps to start using OpNodes 2026 on your TradingView charts.
Log in to your TradingView account and open the chart you wish to analyze. Ensure you have access to invite-only scripts.
Click on the "Indicators" button located at the top of your chart interface to open the indicators library.
Navigate to "Invite-only scripts" section and select "OpNodes" from the available indicators list.
Click on OpNodes to apply it to your chart. The indicator will automatically calculate and display zones based on market opening data.
Learn to interpret the different zones displayed by OpNodes 2026 for effective trading decisions.
Red boxes indicate distribution zones. When price is in the red zone, distribution is considered to be in effect. This is when smart money is selling off positions. Assess for potential selling opportunities or exit points for long positions.
Green boxes indicate accumulation zones. When price is in the green zone, accumulation is considered to be in effect. This is when smart money is building positions at favorable prices. Assess for potential buying opportunities or exit points for short positions.
Dotted lines mark areas where trade adjustments may be necessary. Use these zones to modify your positions, take partial profits, or add to existing trades based on market conditions.
Follow these recommended practices to maximize your success with OpNodes 2026.
Always prefer hedged strategies over naked buying or selling. This helps limit risk and protects your capital in volatile markets.
For Nifty, Options priced above ₹200 are considered expensive options and offer better liquidity. Most effective accumulation and distribution patterns occur in expensive options first. Cheap options (below ₹200) may not show reliable patterns.
Keep a close eye on India VIX levels. Adjust your strategy based on whether VIX is rising (favor buyers) or falling (favor writers).
Use Call and Put options together for comprehensive market analysis. This dual approach provides better decision-making insights.
Use OpNodes 2026 on European Options charts only. The tool is not tested for American options and may not work correctly.
Be patient and wait for accumulation or distribution zones to complete before taking trade decisions. Patience often leads to better entries.
Expert tips to enhance your trading experience with OpNodes 2026.
Find answers to common questions about OpNodes 2026.
Have questions or need support? We're here to help you succeed with OpNodes 2026.